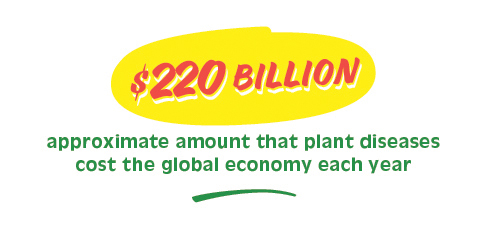
In the first year of the great hunger, roughly half of Ireland’s potatoes turned putrid in the ground. The soil went bad, the potato plants withered, and the wind and rain carried devastation across the land. Over the next six years, three quarters of the crop failed, roughly a million people died from starvation and famine-induced diseases, and a million more fled Ireland forever. Behind this scourge that scarred the psyche of a nation was a fungus-like pathogen called Phytophthora infestans.
Plants are susceptible to pathogens and toxins just like humans and other animals are. “Pathogens represent traditional and non-traditional threats to people,” says Alina Deshpande, deputy division leader for bioscience at Los Alamos. “The traditional threats are pathogens that make us sick, but pathogens can also deprive us of things we need, like food, fuel, materials, and medicines.”
Crops make the world go ‘round, and their loss reaches far beyond the dinner table. Crops provide plant-based foods for people as well as the animals that give us food like meat, milk, eggs, and honey, and materials like beeswax, leather, down, fur, and wool. Crops provide commodities such as textiles, drugs, building materials, bioplastics, and biofuels like ethanol. The growing of crops for all these purposes provides the livelihoods of families and communities throughout the country. Indeed agriculture touches nearly every aspect of modern life. If a crop fails, everything tied to it becomes unstable.

Knowing what’s coming can help growers plan, creating resilience through crop management and strategic resource allocation. To give the nation’s growers a clear picture of which diseases pose the greatest threat to the future of their crops, Deshpande and other scientists are building new tools for data aggregation and predictive modeling. By using genomics, computer modeling, and supercomputing to forecast disease trends, Laboratory scientists are leveraging modern science to avoid another Great Hunger and help care for our crops.
The fungus among us
“Fungi are concerning to humans on two fronts,” says Los Alamos mycologist Aaron Robinson. “They can kill us or they can kill our food.”
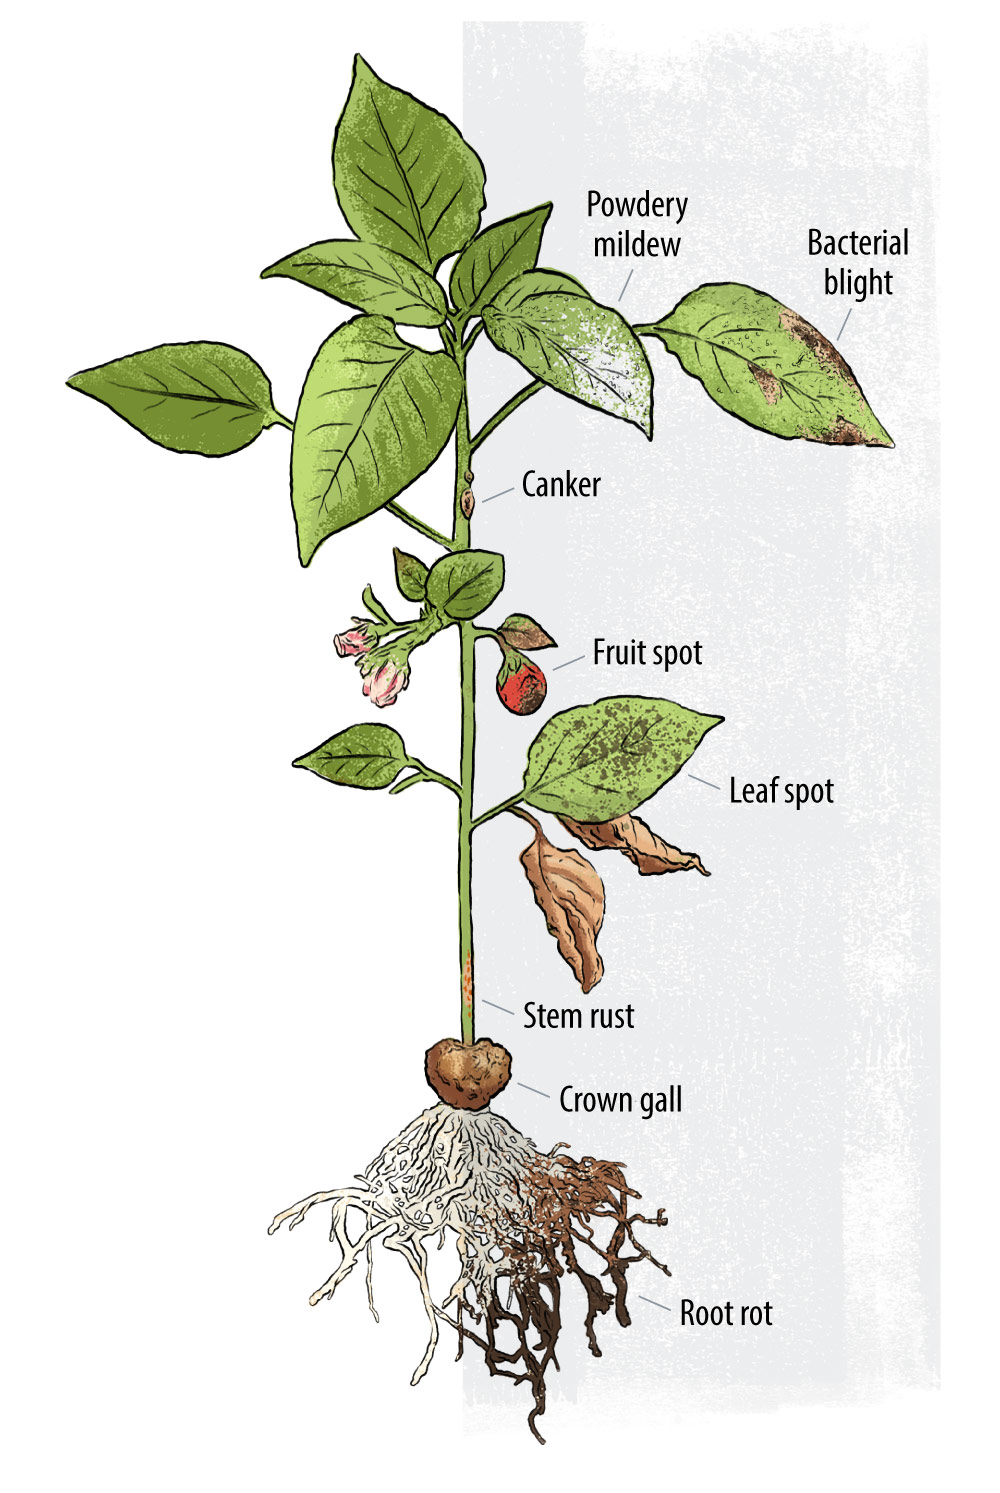
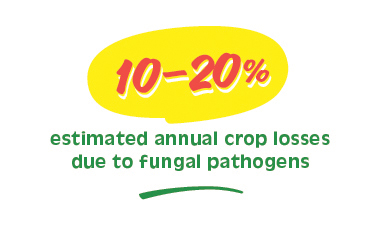
Fungi are behind many of the most concerning diseases today as well as some of the worst crop blights in history. The southern corn leaf blight of the United States in 1970, for example, caused by Bipolaris maydis, is estimated to have resulted in even greater food-energy loss than the potato blight in Ireland. More recently, Puccinia graminis, the cause of wheat stem rust, has been ravaging wheat crops across northeastern Africa and the Arabian peninsula, bringing near complete crop loss in some areas.
But not all fungi are bad. In fact, fungi are critical to the health of an ecosystem, cycling nutrients back into the soil, absorbing water, and keeping bad fungi at bay. Blanketing fields in fungicidal chemicals “just in case” kills the good fungi as well as the bad, wasting growers’ money and harming soil quality in the long term.
“Fungi are concerning to humans on two fronts: They can kill us or they can kill our food.”
Fungal disease outbreaks in crops aren’t usually caused by exotic new species of fungus. It tends to be environmental change that throws a system off balance and allows the bad fungi to overrun the good. Robinson and his team want to better understand the environmental changes that precede those shifts. Which fungi are friends and which are foes, and what does it take for the former to become the latter?
To answer these questions, the team is examining certain species of fungus through what Robinson calls multiomics-based investigations, a combination of genomics, proteomics, transcriptomics and metabolomics. He is focused on the fungus genus Monosporascus because the species in this genus inhabit arid ecosystems and represent both friends and foes, therefore providing a useful model for learning about fungus-plant interactions. Arid ecosystems are of interest because climate change projections say both heat and drought will be more widespread in the future, so humanity will need to know what to expect from fungus-plant interactions in these places in particular.
The multiomics approach provides a functional perspective: not just which genes each fungus has but what the fungus is actually up to—what it’s eating, where it’s living, how it’s reproducing. These kinds of analyses are complicated for fungi because, although they are microbes, like bacteria and viruses, they also are eukaryotes, like plants and animals, which means their genomes are large and their cellular processes are elaborate. All of the “omics” for fungi are more complex than for bacteria or viruses.
The methods Robinson is developing will help characterize new fungi too, when they appear. “There’s no mugshot to compare suspects to,” says Robinson. “So multiomics is a way to build a profile of which characteristics tend to show up in bad guys and which ones show up in good guys.”

Pathogen prediction
In the United States, when a pathogen causes an outbreak in humans, the disease is reported to the Centers for Disease Control (CDC), which track and collate data at a national level, offering guidance for prevention, diagnosis, and treatment. But there is no CDC for crops. The closest thing is the Animal and Plant Health Inspection Service, within the U.S. Department of Agriculture (USDA), which does monitor select plant pathogens but isn’t solely dedicated to crop disease.
Most crop-outbreak data are collected and managed at the state level, which makes it hard to detect and predict larger patterns. In a move to better integrate the national crop-pathogen picture, in 2020 the USDA’s in-house research agency, the Agriculture Research Service, launched a multi-institutional initiative. The National Predictive Modeling Tool Initiative, or NPMTI, is building a risk-analysis tool to forecast prevalence and trends across the country for key crop diseases. The goal of the project is to give growers the information they need to make informed management decisions. The NPMTI tool will take the form of an online dashboard where a grower can drop a pin on a map and learn the near-term disease risk for that location.

This large collaboration includes plant pathologists from state land-grant universities because they understand how these diseases work in the field. What Deshpande and her team bring to the project is analytics infrastructure—they are outbreak-analytics experts, and they understand predictive modeling tools. Now, the Los Alamos scientists are adapting their existing analytics methods to crop-disease forecasting.
But analytics for crops require more features and data sources than what the scientists included previously for human pathogens. Each crop species has different data associated with it, so the modeling has to be crop-specific, which is why the project is focusing on the big three—wheat, corn, and cotton—for now, with plans of adding more, like soy and citrus, in the future. Climate and weather data must be included as well, because the transmission of plant pathogens relies more on environmental factors, like wind and water, than human pathogen transmission does. As global climate change disrupts local weather patterns, growing seasons will shift, temperatures will fluctuate, and water availability will change, all of which directly affects disease risk.
Information about each pathogen—its target species, modes of transmission, lifecycle, growing conditions, disease manifestation—will be built into the tool. When a grower pins a particular field, the various NPMTI analytics tools will churn through everything known about the crop of interest, relevant pathogens, recent weather, and weather predictions for the area, then spit out a relative risk for disease spread and forecasts. Armed with that information, the grower can then decide, for example, whether it’s wiser to spend money repairing equipment or spraying a field with fungicide.
“We want it to follow the cup-of-coffee rule,” says Will Rosenberger, a computer scientist on the Los Alamos NPMTI team. “It should be fast and clear. A grower should be able to sit down in the morning, and in the time it takes to drink a cup of coffee, get immediate answers to help guide decisions that day.”
The NPMTI project is in year three of a five-year initial plan, with 26 states so far included and the target of being able to run models that cover the entire country. However, whereas the NPMTI dashboard is not yet deployed to the public, another tool being developed by Deshpande and her colleagues is already up and running.
A grower needs to be able to sit down in the morning and get immediate answers in the time it takes to drink a cup of coffee.
You are here
What if it’s too late for a grower to ask about what’s coming because the corn already has spots or the wheat is already blotched? What if the immediate need is to stop the spread? Los Alamos scientists have a tool for that, too.
Back in 2017, Desphande and her team developed the Analytics for Investigation of Disease Outbreaks, or AIDO (pronounced “I do”), to enhance situational awareness of an unfolding human infectious-disease event. AIDO uses a similarity algorithm to match a current situation to recent one, providing a sort of “here’s how it went last time” perspective.
In 2022, the director of the NPMTI project called Deshpande and asked about using AIDO for crops. But crop data are different from human data—multiple host species must be included and transmission pathways are weather-dependent—so Deshpande didn’t think AIDO would work as-is. She suggested they develop a new tool specifically for crops, and that tool, AIDO4Crops, is now freely available online for anyone to use.
“We specialize in the similarity algorithm,” says Los Alamos molecular biologist Nileena Velappan, who worked on the original AIDO and now leads AIDO4Crops. “This is probably the only algorithm-based tool for multiple crops at once.”
Whereas the NPMTI dashboard will be predictive, telling growers which way the wind will blow, AIDO4Crops is historical, telling growers what happened before. A grower can enter a location, a crop, and a disease, and the tool will sift through a database of outbreaks to find the one that best matches.

For example, if a corn field in Iowa turns up with tar spot in the first week of August, the grower can enter that information, and the algorithm will find other times that a field in that county, or a neighboring county, came up with tar spot in or around the first week of August. It will tell when the outbreak started, how long it lasted, how far it spread, and which crops were affected. Perhaps most useful to a grower with a budding pathogen problem, the tool also reports what mitigation actions were taken and whether or not they worked. So the grower can get a boots-on-the-ground look at what might or might not help curb the unfolding situation.
AIDO4Crops offers information about the pathogens, reference photos, timelines of historical outbreaks, occurrence maps, and other important contextual information. Building the tool was a front-loaded problem, with a lot of effort going into the data acquisition. Each state collects their own crop-disease data, so there is no central repository for Velappan to pull historical data from. The team had to gather the data piecemeal, state by state, mainly from plant pathologists at land-grant universities. There is no standardization between datasets either, so the Los Alamos team had to convert datasets into the same format before they could be added to the library. At present, AIDO4Crops contains about 150 disease occurrence records, some going back as far as 2005, but most more recent. The team keeps it updated, adding new outbreaks as each year passes.
For a grower with a budding pathogen problem, it helps to know what mitigation actions were taken before, and whether or not they worked.
“We are focused on 2015 and onwards,” says Velappan. “Things change so quickly—like climate change and new technology—that the older data start to not match new events very well. So there’s no point in going too far back.”
Now that the Los Alamos scientists have collected, standardized, and aggregated all this outbreak data, they have essentially built the central repository that was lacking before. The data is online and freely available for others to use.

For now, AIDO4Crops is up and running by itself, but once the NPMTI dashboard is deployed, AIDO4Crops will be linked to it. This will in effect be a one-stop shop for pathogen prediction and mitigation.
Coming soon
“Los Alamos has a history of creating tools to integrate data, and also of being able to handle huge amounts of data,” says applied mathematician Carrie Manore. “We’re really good at integrating multiple disciplines and multiple scales into one big tool.”
“The Lab is really good at integrating multiple disciplines and multiple scales into one big tool.”
Manore specializes in epidemiological modeling. She has previously modeled human pathogens like West Nile virus and Zika virus, as well as plant pathogens like maize lethal necrosis virus and barley yellow dwarf virus. Now she is working on a pathogen prediction model that takes a more global view: the Climate Integrated Modular Model for Infectious Disease, or CIMMID, which runs on one of the Lab’s supercomputers. As with AIDO and AIDO4Crops, CIMMID’s first iteration will be for human pathogens and crop-based CIMMID will be an adaptation of that.
The goal of CIMMID is to predict how landscape and climate change will impact infectious diseases in the future, across the country and the world. “The cool thing about CIMMID,” says Manore, “is that we’re working with the E3SM team to fully integrate climate modeling at a continental scale.” The E3SM project is the Department-of-Energy–funded Energy Exascale Earth System Model, a large ongoing project that uses supercomputers to model all the earth’s systems that affect the nation’s energy needs and resources, which is basically all of them.
Current weather conditions can be entered into CIMMID and the model will predict which infections are likely to increase over the next year or so, as well as how far and how fast they are likely to spread. Manore can alter the conditions and run “what if” scenarios, to explore different eventualities and interventions. She and other Los Alamos modelers did exactly this during the peak of the COVID-19 pandemic. Leaders needed to know what would happen if they closed schools, for example, or if the coming winter were to be especially harsh. Manore and her colleagues built and ran models that tested all the different possibilities, helping state leaders develop action plans.
Once the NPMTI and crop-based CIMMID are both ready, the plan is to integrate CIMMID with the NPMTI dashboard. This way the end users of the dashboard—the nation’s growers—will be able to tap into the vast predictive power of supercomputers and the E3SM project to draw reliable, actionable information for the immediate-, near-, and long-term.
In 2020, the COVID-19 pandemic reminded the world just how far and how fast a pathogen can travel through a susceptible population. What if that susceptible population was the nation’s wheat, corn, or cotton fields? What could be done to stop the scourge and what would be the consequence of failure? It used to be that there was no way to know what was coming around the corner, and growers were at the mercy of Mother Nature. Thanks now to modern methods like multiomics and computer modeling, our food, fuel, and other crop-dependent economies will be more resilient.
“Agriculture can benefit from the tools being developed for human disease preparedness,” says Deshpande. “We are working together now towards a more holistic approach to fighting pathogens.”